Spaghetti Plot: Three Subject Paths an Average Can Hide
A spaghetti plot reveals individual paths an average can hide. Follow three subjects across weeks 0, 1 and 2 to read trends without mixing lines. See how.

A spaghetti plot reveals individual paths an average can hide. Follow three subjects across weeks 0, 1 and 2 to read trends without mixing lines. See how.
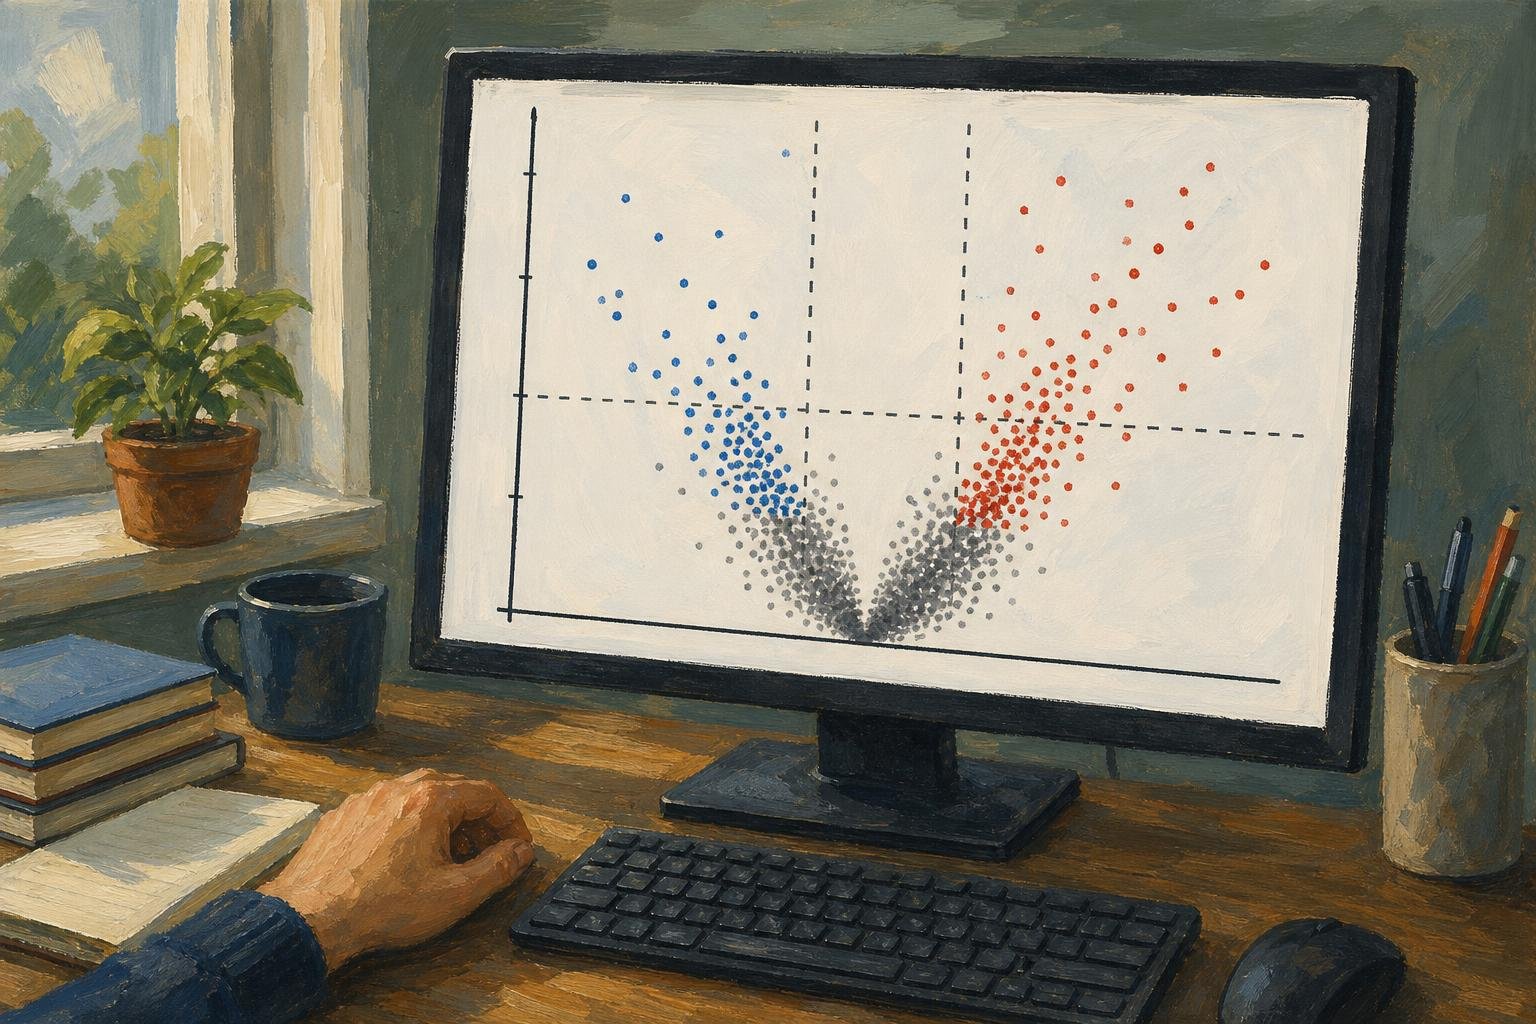
A volcano plot pairs fold change with statistical evidence. Learn why the tallest dots can mean small effects and how to assess candidates. See the guide.

Read a bode plot's gain and phase together to avoid misleading stability judgments. Learn where to measure gain and phase margins; see the worked example.
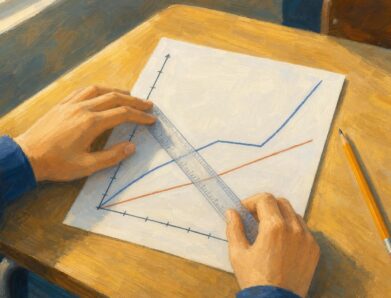
A distance time graph shows distance, not speed. Learn how slopes reveal speed, flat lines mark stops and axes change the reading. See the worked examples.

Flowchart symbols distinguish actions, decisions, and connections. Learn where rectangles, diamonds, and arrows belong to read workflows clearly. See the guide.

What is a timeline? Learn how dated milestones differ from duration bars, using a school-project example to clarify gaps and overlaps. See how it works.
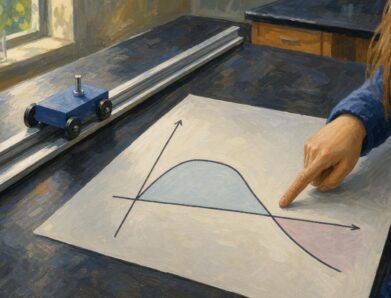
Read a velocity vs time graph using a runner and a reversing cart. Connect slope to acceleration and signed area to displacement. See how motion adds up.

Read a picture graph without mistaking symbols for counts. See how four stars represent 20 books, use the key, and compare categories in the worked examples.
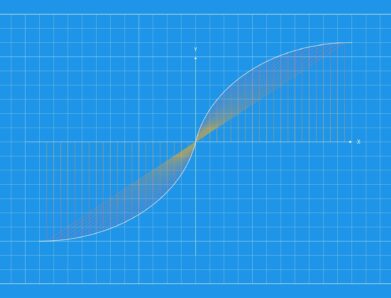
Read the domain and range of a graph by checking each axis, endpoints, gaps, and turning points. Get the notation right—see the step-by-step explanation.

An absolute value graph has two rays and a sharp vertex. Learn how the equation sets its shape, range, and intercepts, then plot it correctly. See how here.