


Recommended for you
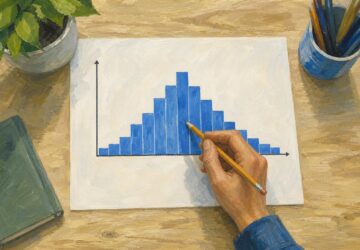
Symmetric Histogram: Balance Beyond the Tallest Bar
A symmetric histogram mirrors bars around a center, not always its tallest peak. Compare tails and see how bin boundaries affect balance. Read the example.

Quadratic Graph: One Worked Example, From Curve to Roots
Plot a quadratic graph using its vertex, symmetry and intercepts. Follow one worked example, explore shifts and recover an equation. See the key steps.

Histogram Patterns: What Clinic Waiting Times Reveal
A histogram turns clinic waiting times into visible clusters and gaps. Learn what bins and bar heights mean, and how to choose bin widths. See the example.

SEO Infographic: Why the Publishing Page Matters Too
An SEO infographic needs more than an image. Connect your search question, visual, file and publishing page in five steps to make it useful. See the steps.

An ER Diagram Shows Where Each Database Fact Belongs
An ER diagram links business rules to data structure. Follow the customer-order example to see where sale prices belong and avoid design gaps. See how.

Flowchart Examples With Labels You Can Make Your Own
Adapt flowchart examples for online orders, leave requests, and login recovery with named actions, decisions, and outcomes. See reusable paths in the article.
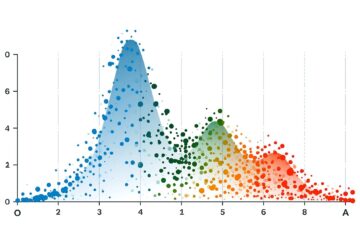
Bimodal Histogram: Two Peaks That One Average Can Hide
A bimodal histogram can reveal two operating conditions. Use the 15 and 25 millisecond test example to read the peaks and plan your next analysis. See how.
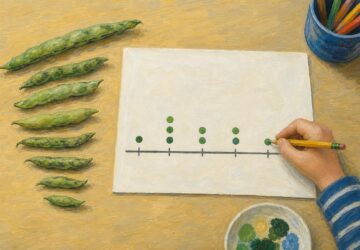
Math Line Plot: Each Mark a Measurement, Each Stack a Count
A line plot turns nine bean pod lengths into visible counts. Learn what marks and stacks mean, then build your own with fractions. See the worked example.